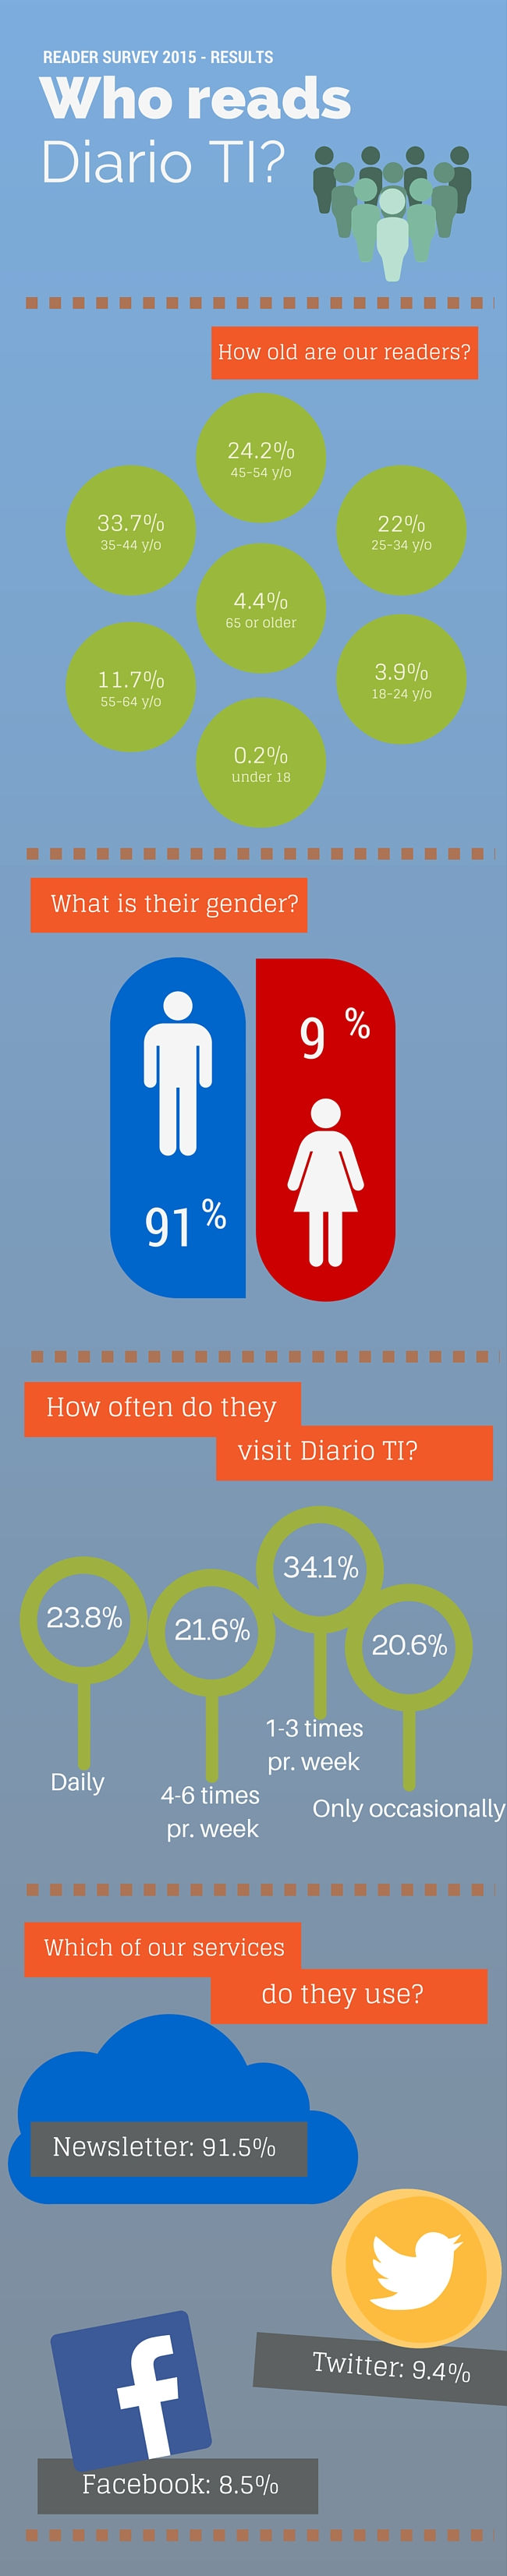
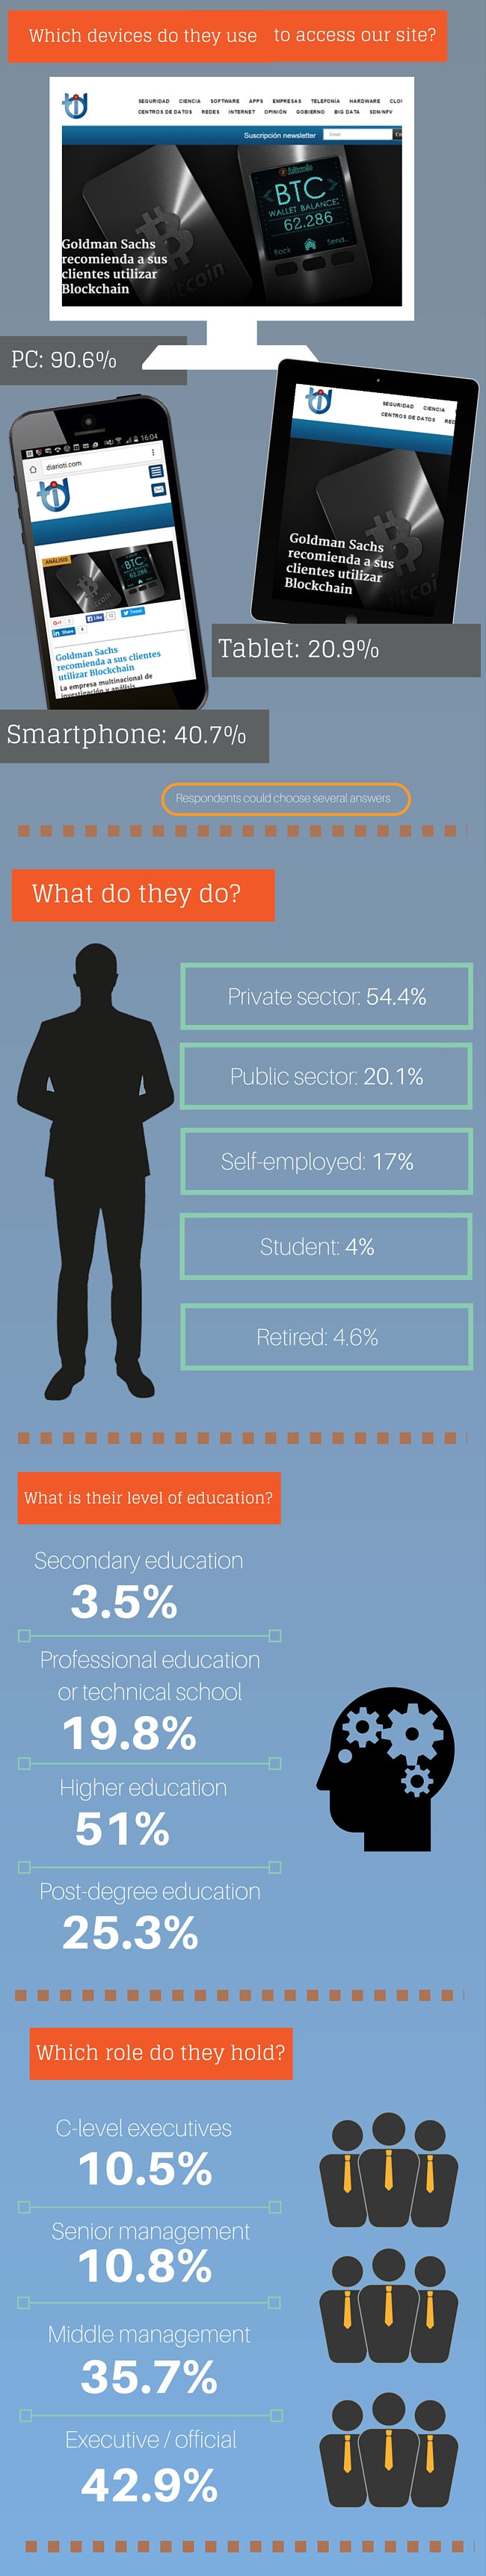
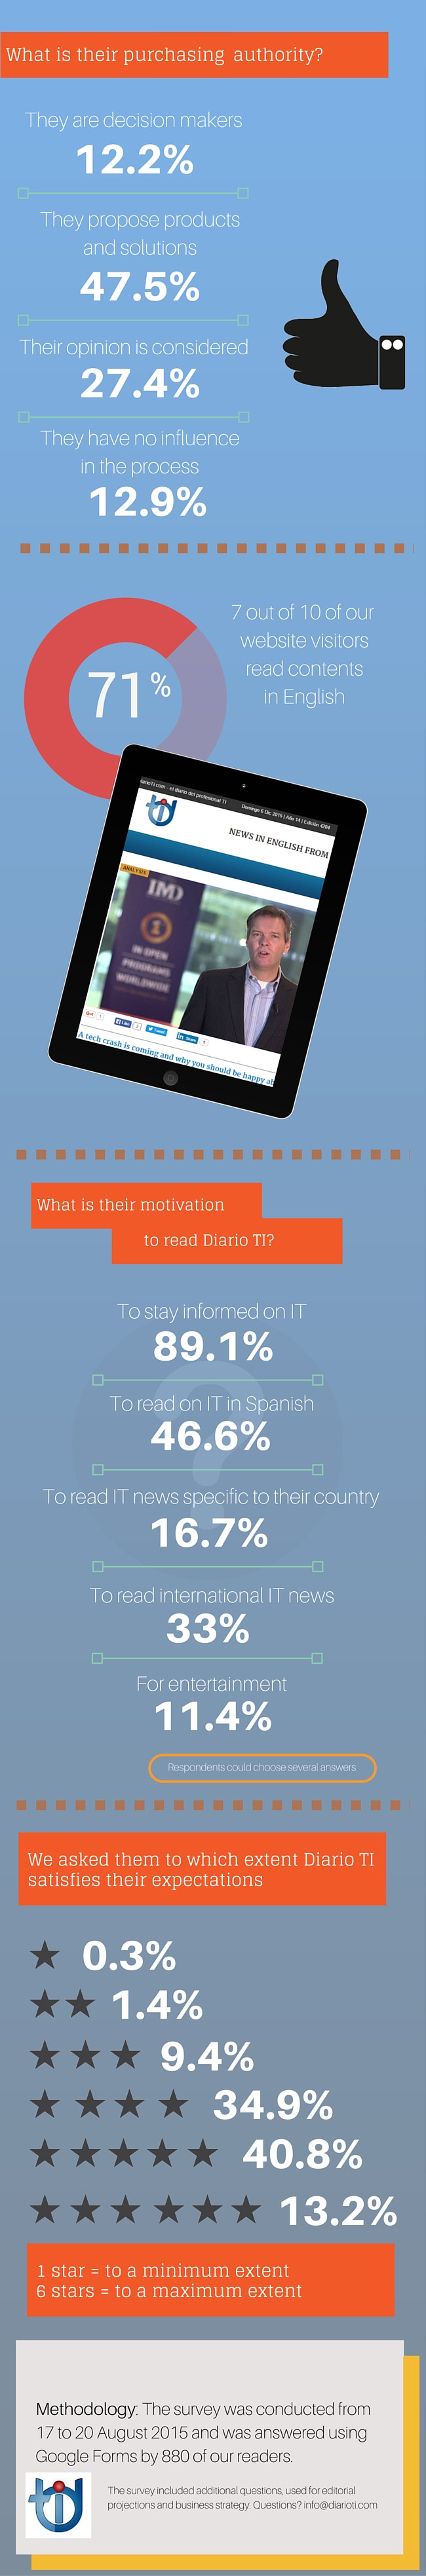
According to a survey conducted in May 2020, the average reader of Diario TI is a university graduate (79.6%), who works in the private sector, where he/she holds a management position (C-suite 16.1%; area manager; 27.3%; middle management 12.7%; owner/board of directors 13.4%). In their work, they have decisive and final decision-making authority (20.3%), propose solutions and products (38.5%) or their opinion is considered (21.6%). On a scale of 1-5, 31.5% rated Diario TI as meeting their expectations for IT information with 5 points; while 49.5% rated our publication with 4 points.
Survey details
On the tables, the responses appear in decreasing order
What is your age?
Response | Percentage | Number of responses |
40-49 | 33.1 | 256 |
50-59 | 27.9 | 216 |
30-39 | 17.8 | 138 |
60-69 | 13.8 | 107 |
Older than 70 | 4.5 | 35 |
20-29 | 2.6 | 20 |
Younger than 19 | 0.3 | 2 |
How often do you visit our site, including when you follow links from newsletters, Twitter and Facebook?
Response | Percentage | Number of responses |
1-3 times per week | 44.6 | 345 |
Only occasionally | 37.9 | 293 |
Daily | 12 | 93 |
4-6 times per week | 5.6 | 43 |
Do you follow us on?
Response | Number of responses |
Newsletter | 571 |
None of the above | 107 |
Newsletter and Twitter | 32 |
22 | |
Newsletter and Facebook | 15 |
14 | |
Newsletter, Twitter and Facebook | 12 |
Twitter and Facebook | 1 |
What is your main occupation or sector?
Response | Percentage | Number of responses |
Private sector | 55.9 | 433 |
Public sector | 13.6 | 105 |
Self-employed | 12.8 | 99 |
Academic | 9.8 | 76 |
Retired | 7.1 | 55 |
Student | 0.8 | 6 |
What is your educational background?
Response | Percentage | Number of responses |
University | 48.3 | 374 |
Postgraduate | 31.3 | 242 |
Technical | 15.8 | 122 |
Secondary | 4.7 | 36 |
Note: The effective figure for university studies is 616 (79.6% of the total), as postgraduate studies necessarily involve a university undergraduate degree.
Which is your role within your organization?
Response | Percentage | Number of responses |
Executive / official | 30.5 | 236 |
Area manager | 27.3 | 211 |
C-level (CEO, CIO, CFO, CISO, CTO) | 16.1 | 125 |
Owner / Board of Directors | 13.4 | 104 |
Middle management | 12.7 | 98 |
What authority do you have in the acquisition of products or procurement of services?
Response | Percentage | Number of responses |
Propose solutions and products | 38.5 | 298 |
Your opinion is noted | 21.6 | 167 |
Decisive and final authority | 20.3 | 157 |
No influence | 19.6 | 152 |
Do you prefer to read?
Response | Number of responses |
News and opinions / analysis / reports | 526 |
Only news | 115 |
Opinions / analysis / reports | 133 |
To what extent do the contents of Diario TI meet your expectations for IT information? “5” is the highest score, and “1” the lowest.
Response | Percentage | Number of responses |
4 | 49.5 | 383 |
5 | 31.4 | 243 |
3 | 18.1 | 140 |
2 | 0.8 | 6 |
1 | 0.3 | 2 |
Would you be interested in listening to TI Diary podcasts?
Response | Percentage | Number of responses |
Sí | 63.8 | 494 |
No | 36.2 | 280 |
Original article on the survey, with additional information: Resultados Encuesta 2020 Lectores de Diario TI